04 Apr What Risks are Hiding in This Graph?
Some of us love numbers…others not so. Some think in pictures…others simply can’t. Combining the two helps to tell a great story.
Translating information into visuals is an impactful way to make sense of the work we do. From the data we collect, business leaders have an opportunity to drill down and identify the potential root cause of risks in their workplace.
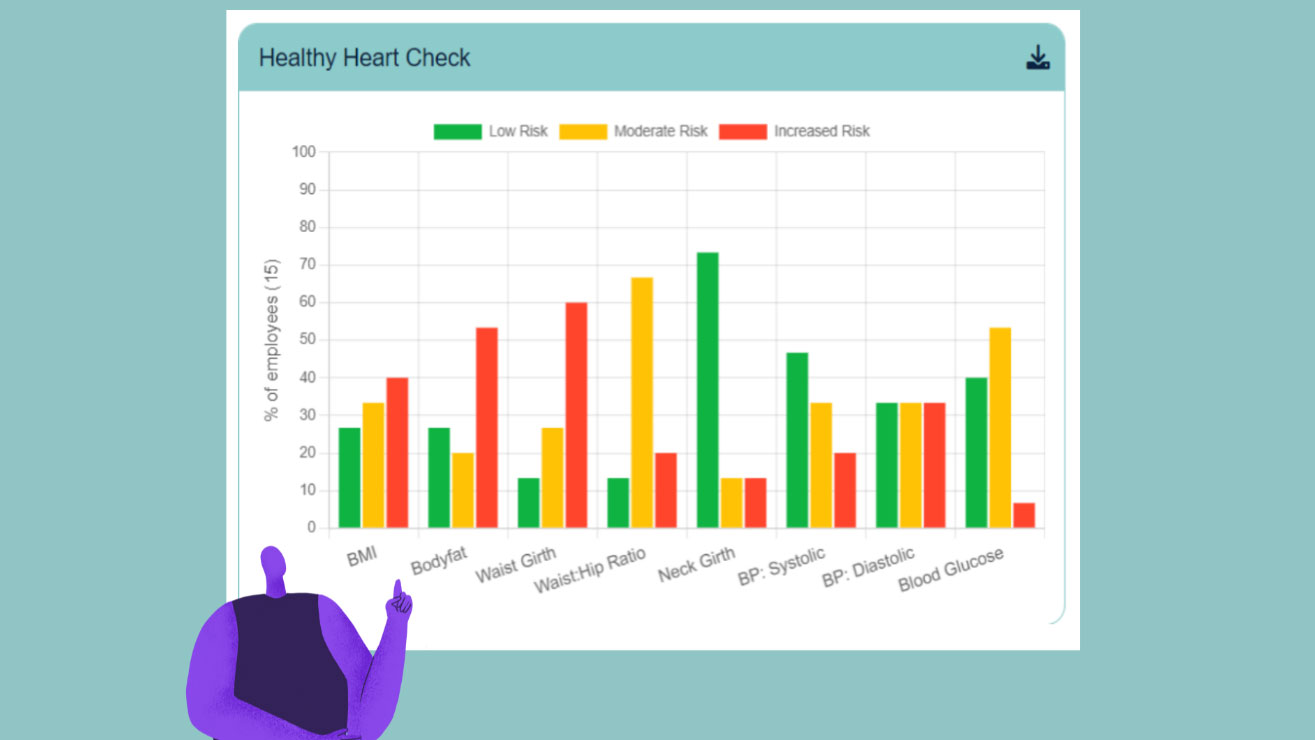
For example – we conduct Health Heart Checks on site where there are 8 risk factors that we assess. Each factor is classified into a traffic light warning system of green (low risk), yellow (moderate risk) and red (increased risk). There are a series of general graphs and displays of the generic risk profiles available for employers / managers.
The graphs aren’t particularly fancy, they only have a few bars, words and numbers, yet they communicate meaningful information highlighting exactly the level of risk in your employees. Have a look at the following graphs.
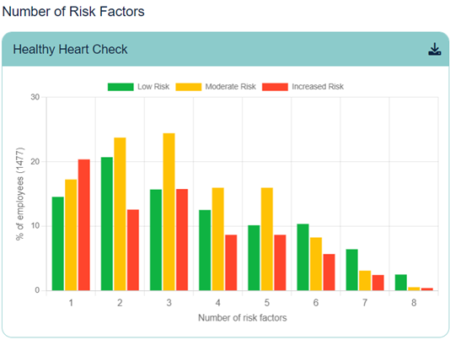
There are 1477 employees (vertical y axis) with the percentage and risk classification linked to each risk factor. The number of risk factors (1-8) assessed are displayed on the horizontal or x axis.
This graph tells us that 215 (14%) have 1 risk factor in the low risk. 255(17%) in moderate risk and 301 (20%) at increased risk. Thereafter the yellow (moderate risk) category dominates employees who have 2, 3 ,4 and 5 risk factors in this category. At the extreme end there are 37 (2.5%) who have all 8 risk factors in the green or low risk. There is 8 (0.5%) and 6 (0.4%) in the moderate and high risk for all 8 risk factors.
While there appears a regular green (low risk) column, the champions of the groups have 6, 7 and 8 risk factors in green.
To make greater sense of the data, we drill further to determine what risk factors are dominate within the group. This graph helps us work with organisations to determine where interventions and support need to be channelled. We remove the “Where do we start?” guesswork.
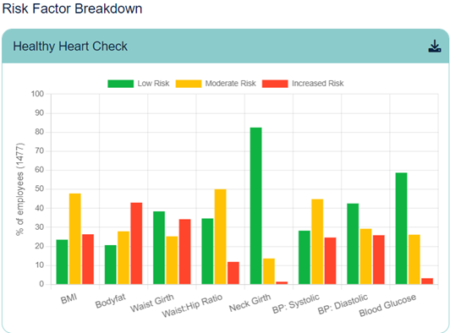
In the Risk Factor Breakdown, the same data classification system is used. The vertical (y axis) represents the percentage of the 1477 employees across the various risk categories. The horizontal (x axis) identifies the actual risk factor and classification within the group.
For example, the dominance of green (low risk) for neck girth is a standout. Over 80% of the group do not have an issue with neck circumference. Non-fasting blood glucose levels suggest that type 2 diabetes is unlikely in nearly 60% of the group. Generally, 30-40% of the group are managing their risks. However, when the yellow and red columns are combined with factors like blood pressure, body fat, BMI and waist girth the data suggests there is work to do for the group.
Not surprisingly, the risk factors that draw our attention present as a defined cluster. Dr Norman Swan says risk factors hunt in packs and this data is no exception. This situation presents a bigger challenge than when the group has one dominate risk factor that needs attention.
Analysis of data at this level gives employers the best shot at getting any intervention correct. To be able to get access to information for the most efficient and effective intervention to be implemented is of great assistance to those making the decisions on health, safety and performance in any workforce.
Interpreting what the numbers mean to your organisation is what Optimum does well. We add value to what really is happening in your workplace by understanding and utilising the data on your employees.
Get in touch if you wish to know more and how your group can benefit from our approach.